Conditions on anything
Is, isn’t, more than, between, one of these, starts with. Compare a column to a value, to a list, or to another column — and the tool keeps totals and individual rows straight for you.
Build a report by clicking blocks together. Everyone who reads it can see exactly which conditions produced the figure — so nobody has to ask what’s in it, and nobody has to wait for someone else to check.
Works with the database your business already runs on.
Every report is built the same way. Pick your conditions, say how they go together, and choose how you want to see the result.
A date range, a region, a product line, a price above a number. Each one you add gets its own colour, and you can follow it across the whole report.
Both of them, either of them, all except these. You click the blocks together and the shape of the logic is there on the page for anyone to read.
A written sentence, a sortable table or a chart. Change anything earlier in the chain and everything after it updates on its own.
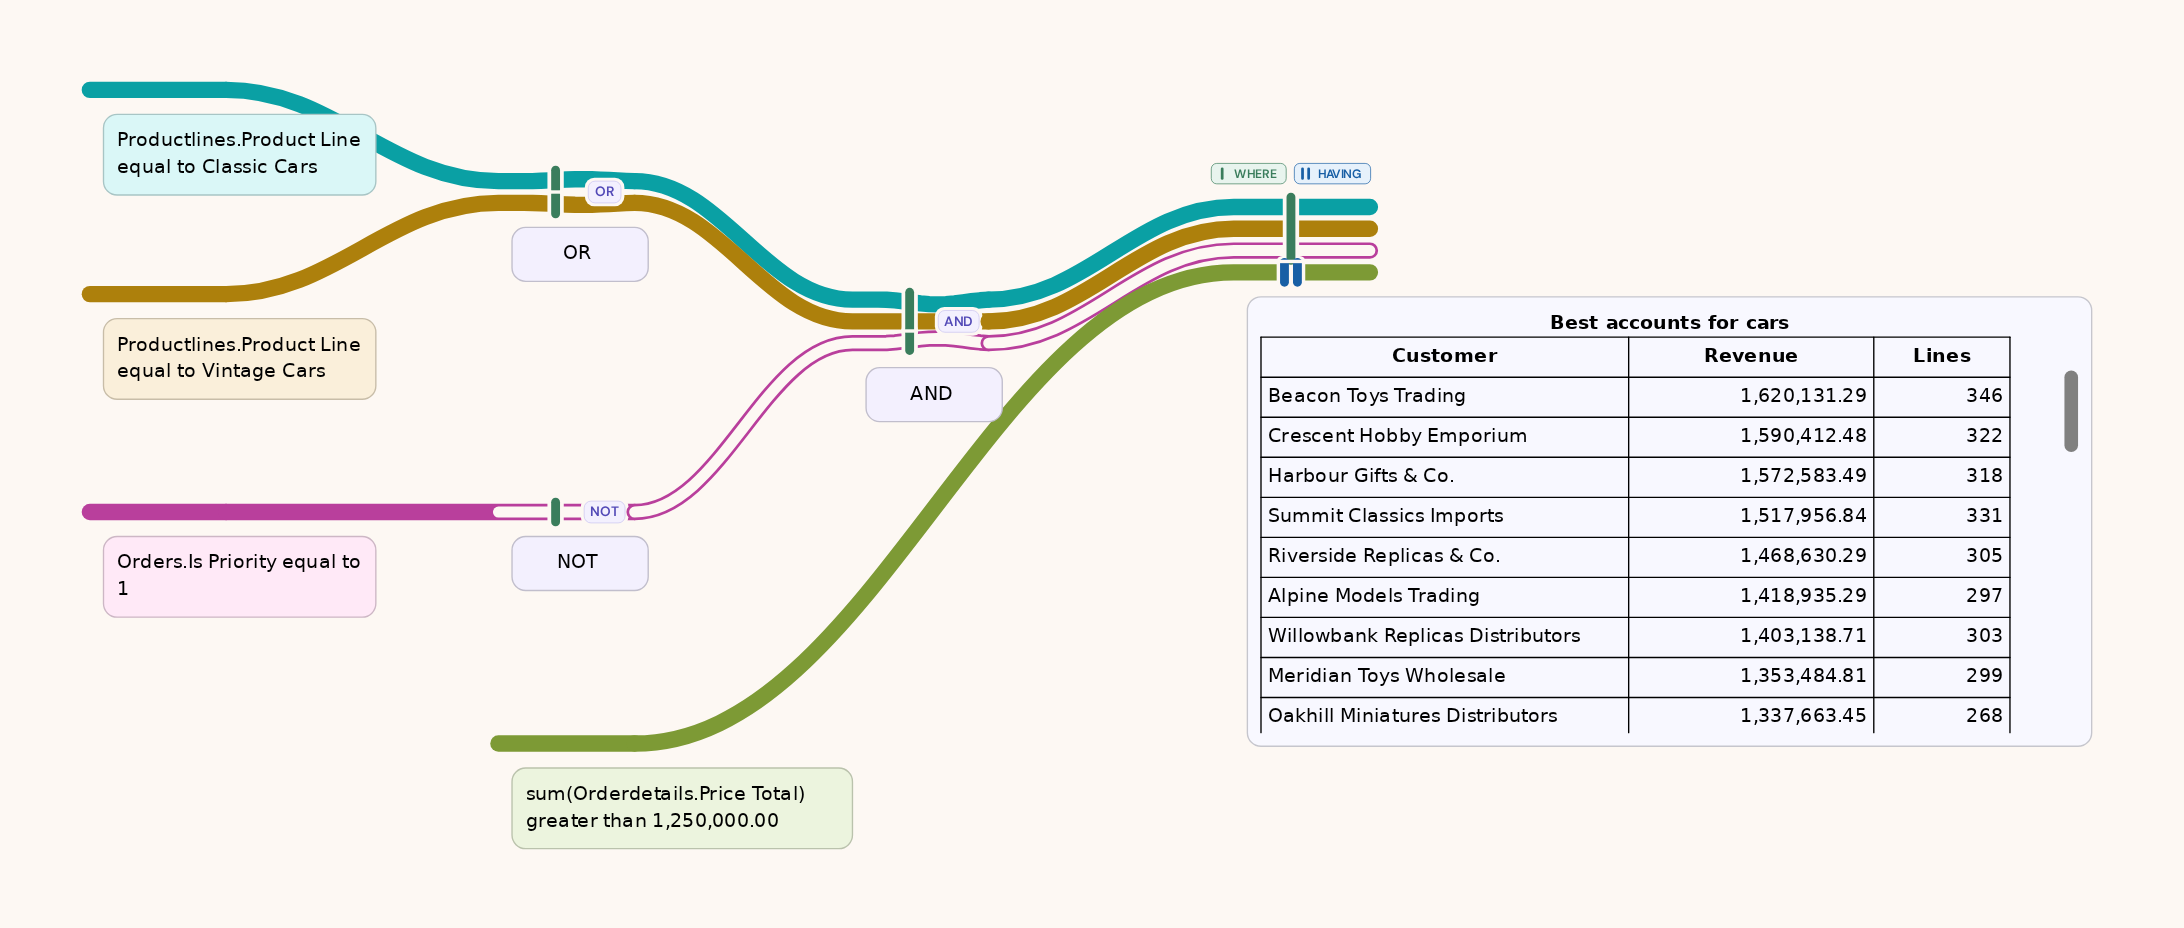
Most tools give you a list of filters that all have to be true at once. Ask for something real — this year or last year, but not the clearance sales — and they hand you a formula to write. Here you click three blocks together. You can see the logic, and so can everyone who reads the report.
AND everything has to be true.
OR any one of them will do.
NOT hollows the ribbon — that’s the exception you’re leaving out.
Count the ribbons arriving, and you know how many conditions shaped the number.
Is, isn’t, more than, between, one of these, starts with. Compare a column to a value, to a list, or to another column — and the tool keeps totals and individual rows straight for you.
One ribbon is exactly one condition, so the number of ribbons arriving at a result is the number of conditions behind it. Hover one and it lights up its whole path.
Build up whatever shape the question needs by clicking blocks together. See a real example →
A written statement with the live figures inside it, not a number floating on a tile. Or the same data as a sortable table or one of eight kinds of chart.
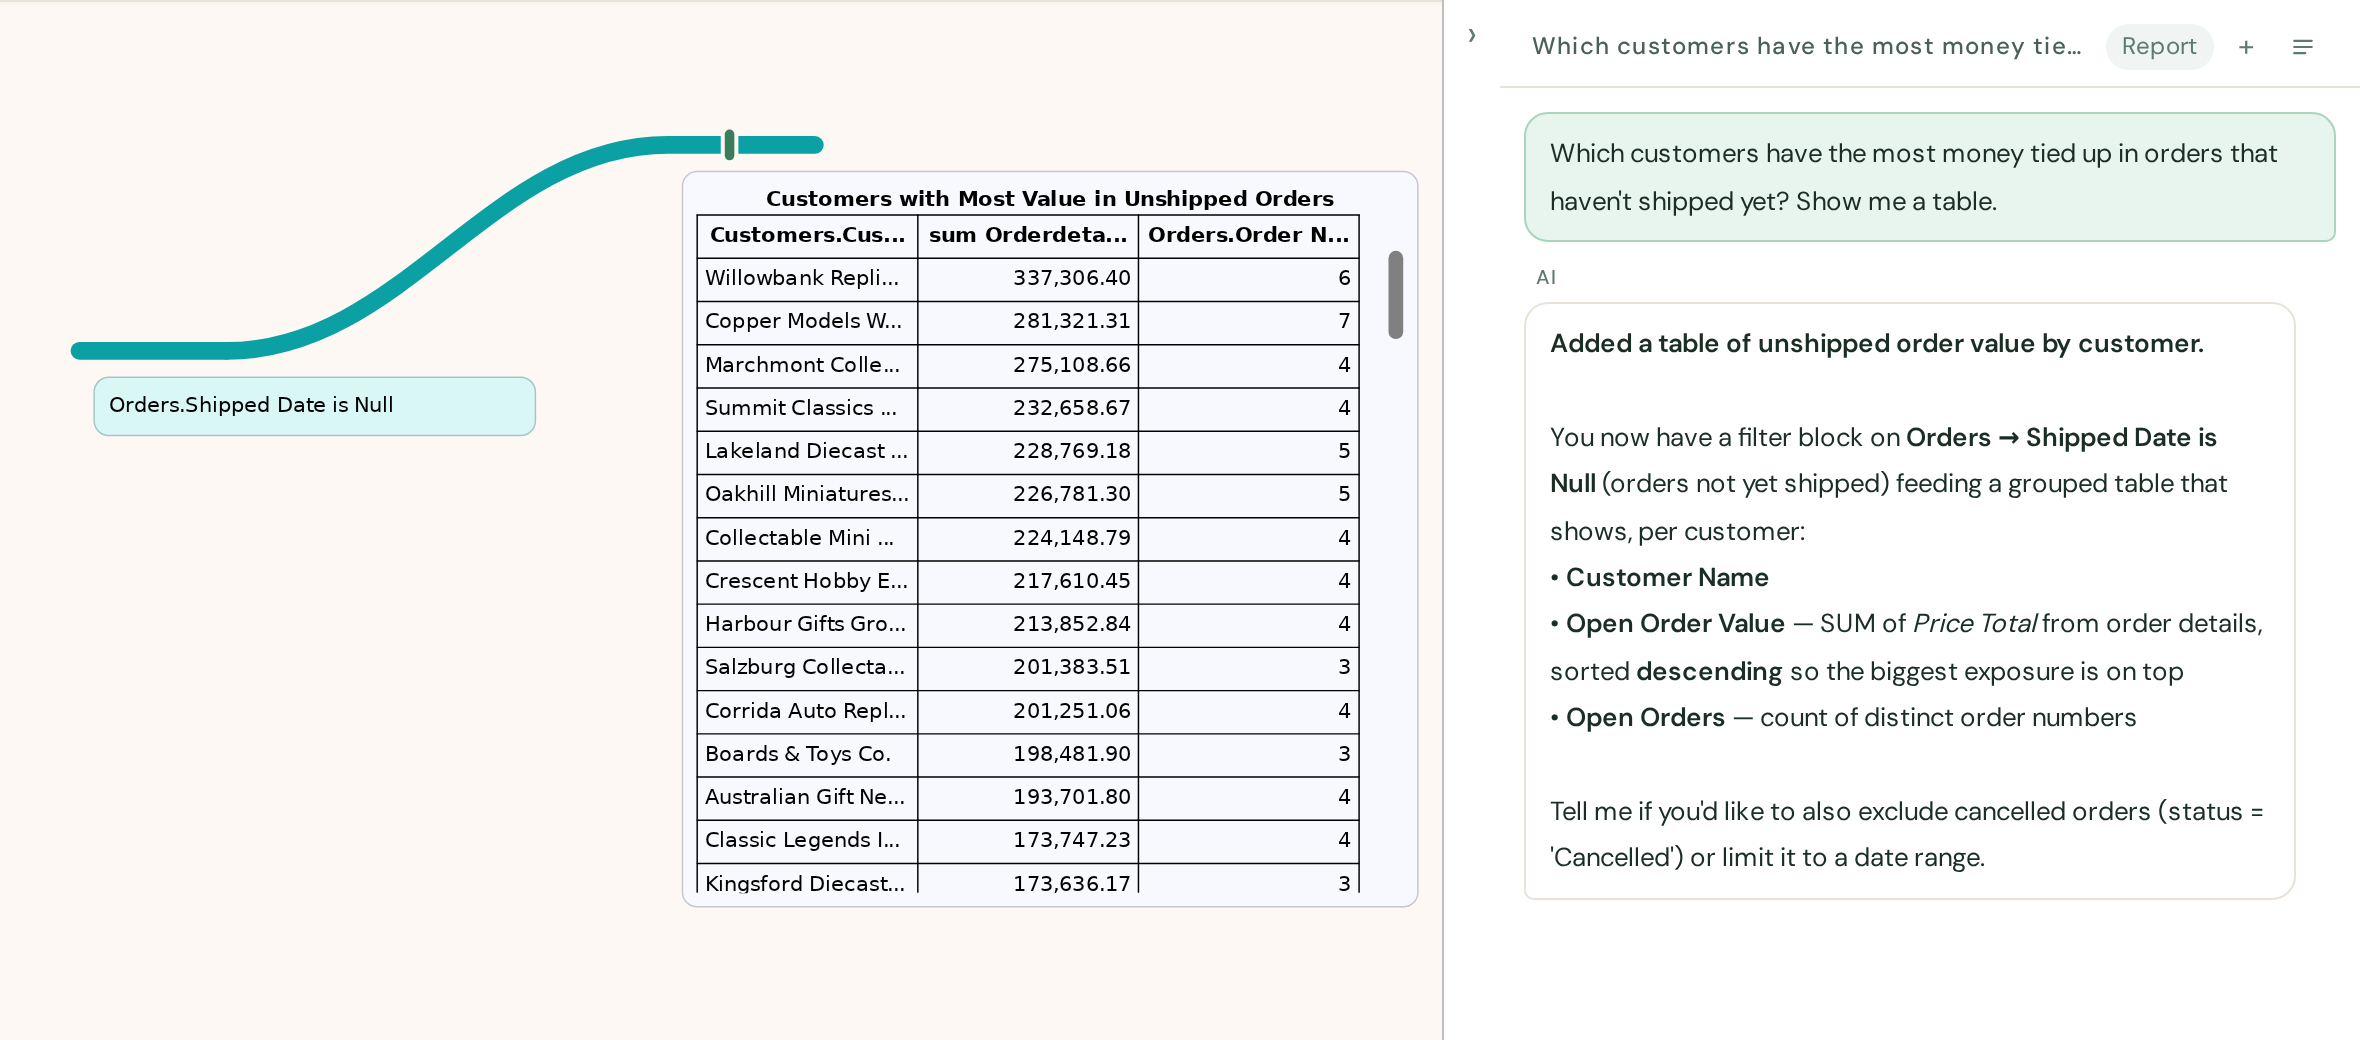
Ask in plain English and it clicks the same blocks together that you would have. Bring your own model — Anthropic, OpenAI or Google Gemini — with no surcharge from us.
Invite people, decide who can look and who can change things, and work in the same report at the same time. You can see who else is in it.
A summary block is a written statement with the live figures in it: “We shipped 1,284 orders to 19 countries last quarter, worth €3.3M”. That is how findings actually get passed on — in an email, in a board pack, in a paragraph someone reads. Put several results on one page and you have a dashboard, but one where the reasoning behind each figure is drawn in.
Most assistants hand you an answer you cannot check and have to either trust or throw away. Ask this one a question and it clicks together the same blocks you would have — so you can move them, change them, or undo them, and anyone can read what it did. If it wants to change something bigger, it shows you first and waits.
Both of these are straight out of the application, on the sample data every new account starts with.
There is no copy of your database anywhere. Questions run against your own, and only the answers come back for you to look at.
Two people can work on the same report at once and both keep their work. It saves as you go, and it only says saved when everything really is.
If you would rather keep everything in-house, it installs on ordinary web hosting — no special infrastructure and nobody else’s cloud.
Connect your database and build your first report in an afternoon. You start in a working sample, so there is something to play with before you have found any passwords.